Next: Handling more difficult source Up: Ravel User Guide Previous: Installing Ravel
When getting started with Ravel, it is good to start with a spreadsheet that is already formatted in a multidimensional way. The following tables shows two 3D examples, one where all dimension labels are stored in columns, and the other where one of the dimensions is spread across the remaining columns:
|
|
||||||||||||||||||||||||||||||||||||||||||||||||||||
These represent the two basic types of multidimensional spreadsheets that Ravel will recognise automatically. However, Ravel provides tools for handling more complex arrangements of multidimensional data, with a modicum of user input, something we'll touch on later.
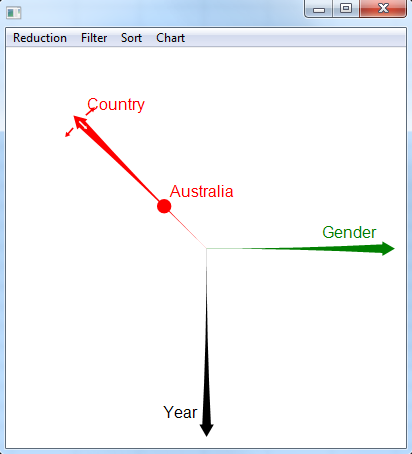
Load up one of the example dataset, and press the “newRavel” macro button. A new workbook is created with two sheets, an input sheet which is pretty much a copy of your original spreadsheet, and an output sheet, which contains the ravelled result. As well as this, a popup window is created, which allows you to manipulate the data. With the above spreadsheet examples, the Ravel window looks like

Now click on the axis marked “Country” and drag it over the “Gender” axis. The axes switch positions, and the output spreadsheet automatically updates its values to be country by year instead of gender by year. You have just performed a rotation of the 3D datacube, so that you are looking along the gender axis now. Similarly, notcie the small spot, which was originally labelled “Australia”, and is now labelled “Male”. This refers to the 2D slice of the datacube that you are now viewing. Drag this spot to where it now says “Female”. You have just changed the slice of the datacube to be looking at female data. Are you interested in aggregating sales over gender? Simply double click on the gender axis, and now the sales data is aggregated over both genders. Double click again, and the axis expands to allow you to examine the individual data items again.
Congratulations, you have now performed all the basic operations of OnLine Analytics Processing (OLAP), namely pivot (or rotation), slice, roll-up (aggregation, or reduction) and drill down (reversing the aggregation operation). Ravel also allows some forms of dicing by means the the filter concept.